Triple Top Chart Pattern Explained
- In this article, we will discuss about the Triple Top chart pattern.
- If you don't know how to trade the triple top chart pattern, Then this article will help you a lot.
- You can increase your knowledge about technical analysis by reading this article.
TRIPLE TOP PATTERN
- A Triple Top chart pattern is a bearish trend reversal chart pattern.
- This chart pattern formed at the top after the end of an uptrend.
- A formation of a triple top pattern is a signal of a bearish trend reversal.
- Triple Top pattern is an extension of the double top chart pattern.
- This pattern appears as a neckline with three peaks.
• How is the triple top pattern formed?
- A Triple Top pattern formed after the end of an uptrend, Which indicates buyers are becoming weak.
- When the price action moves up, it formed a higher-high and higher-low.
- The price is bouncing back before breaking the highs (first and second top), it means buyers are unable to make a new high above the previous high (first and second top), Which shows sellers are coming back.
- The blue coloured horizontal line in the image is called the "neckline" of a triple top pattern.
- After the triple top pattern breakout, the price action shifts from HH-HL to LH-LL (initiating the bear trend).
- The previous trend of the market was up, and after a Triple Top chart pattern breakout, the trend is reversed to the downside.
- Therefore, this pattern is called the bearish reversal chart pattern.
• How to recognize a valid triple top chart pattern?
(a) A Triple Top pattern is valid if all three highs are almost same.
- (b) If price action forms a lower-high without breaking the previous highs, then it's a valid triple top pattern.
- By connecting the three highs, it formed a slightly downward shifting trendline.
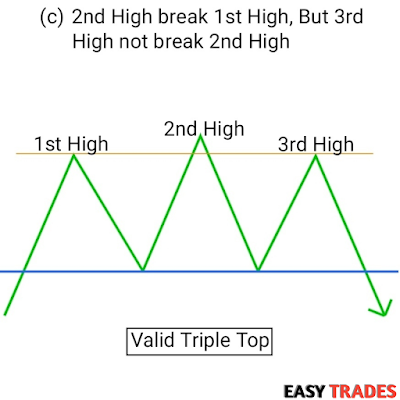
- (c) The second high break the first high, but the third high does not break the second high.
- Similar to the Head and Shoulder pattern.
- (d) If the third high breaks either the first or the second high, it is an invalid Triple Top pattern.
• How to trade the Triple Bottom chart pattern?
- A triple top pattern is activated when the price action breaks below the neckline.
• Entry :
- Take entry when the candle is closed below the neckline.
• Target :
- The target should be equal to the distance between the neckline and the tops.
• Stop Loss :
- The SL should be placed above the previous top of the pattern.
SHORT QNAs
1) What does triple top pattern mean?
- The triple top pattern is a technical analysis chart pattern that indicates a change in trend.
2) Is triple top bearish or bullish?
- A triple top is a bearish chart pattern, which formed at the top.
3) What is the success rate of triple top pattern?
- The success rate of the triple top pattern is approx 65-80%.
4) What is the opposite of triple top?
- The opposite of the triple top is the bullish triple bottom pattern.
5) Triple Top pattern is a signal of ______.
- Bearish trend reversal
6) What is triple top target price?
- The target price should be equal to the distance between the neckline and the tops.
7) What is triple top stop loss price?
- The SL should be placed above the previous top of the pattern.
Thanks For Reading Article....... 📝
Read More >>


No comments: